Technology
TV Interference
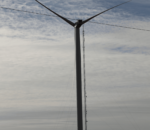
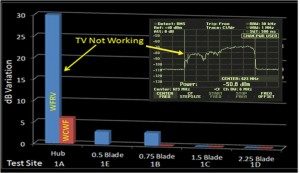 Digital TV uses 8-level amplitude modulation (8-VSB). Reception is sensitive to interference caused by wind turbines, which can alter the signal amplitude when it passes through the spinning blades (chopped) or when it is reflected from the blades (multipath). The graphs to the right show the impact of a UHF TV signal passing through spinning blades. The interference is strongest when the signal-receiver line of site passes through the turbine hub.
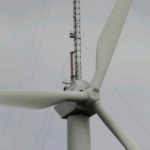 Multipath interference is caused by a signal bouncing off a turbine and creating a delayed signal (echo)that arrives at the receiving antenna after the primary signal and adds to the amplitude of the primary signal at the receiver. The “ghosts” seen on old analog TV sets were caused by echoes adding to the primary signal at the receiver. Multipath signals reflected from spinning blades introduce additional distortion due to Doppler shift of the echo. Today’s digital television receivers contain circuitry that can identify and cancel echoes – up to a point.
Weak signals from distant broadcasters are especially susceptible to multipath interference. The Longley-Rice TV signal propagation map to the left illustrates an example of a town to the east of a mountaintop wind farm that lost reception of TV stations that were more than 35 miles to the southwest. The developer had to restore lost reception by building a tower with translators to serve the affected area.
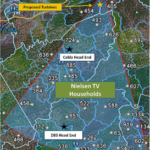 A pre-build TV RF survey can advise the wind farm developer of the number of Nielsen TV households (by census tract and block) within the area of potential impact and the locations of the cable and satellite pickup facilities (head-ends) that rely on local broadcast signals. It can also indicate mitigation options in advance of construction that will enable the developer to budget for their costs. The map to the left shows an example of the data collected and reported in a pre-build survey.Broadcast Wind has received funding from the USDA to research and deploy advanced DTV / wind turbine interference computer modeling for the Broadcast and Wind Energy Industries.
Back to Top
AM Interference
Turbines within 1-3 km of AM radio transmitters can alter the AM signal coverage from its FCC prescribed pattern, which can lead to FCC fines levied upon the station, lost audience, and post construction lawsuits. When needed to preserve the pattern, tower mitigation is accomplished by “de-tuning” the mast with wires and metal rods so that it becomes “invisible to” the AM antenna array.
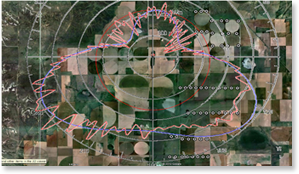
The alteration in signal pattern due to a wind farm can be predicted by RF modeling and simulation. The AM broadcast antenna elements induce currents in nearby wind turbine masts, which in turn become passive radiating elements. The model enables the alteration in antenna pattern caused by these passive elements to be calculated as functions of turbine locations. The figure at right shows an example of the change in pattern calculated by a pre-construction model of a proposed 50-turbine wind farm near a 5-element AM antenna array. The smooth curve (blue) is the FCC authorized pattern; the jagged one (red) is the simulated coverage pattern. The model enabled the developer to adjust the siting of the turbines to minimize pattern alteration and to identify which turbines needed mitigation.
Spark Hazard During Construction
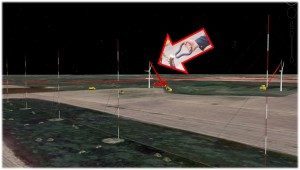 An AM radio station produces a strong electromagnetic field. The loop made by the crane boom and cable forms a receiving antenna that produces an RF voltage at the crane hook. If the crane hook comes into contact with a worker or a grounded object, an electrical arc will be produced. This arc can cause a painful burn, or startle-and-fall hazard to a worker on an elevated work area. If near combustible materials or petroleum products the electrical arc can be a source of ignition.
RF modeling can determine site-specific measures needed to maintain a safe construction site.
FM Interference
Analog FM is generally insensitive to interference caused by wind turbines. Multipath and chopping affect signal amplitude; the FM
receiver detects frequency modulation. As long as the amplitude perturbation is sufficiently lower than the direct signal, the FM receiver will ignore it.
Digital radio is being transmitted by many FM broadcasters. The FCC authorized “HD radio” is a hybrid system proprietary to iBiquity. Low amplitude digital signals are included in-band. Audio compression enables low data rate with good signal-to-noise. Its modulation method is OFDM (like European DVB-T), so theoretically HD radio should be robust to multipath interference caused by wind turbines. More study is needed to characterize its robustness to multipath from turbines.
R & D
Distributed Wind Energy
Local broadcasting and record low cost wind energy technology present a tremendous, yet untapped economic opportunity for rural farms and their communities across the nation. There are approximately 18,000 broadcast transmitters distributed across the US. In the coal powered Midwest and South Central states, the majority of broadcast transmitters stand alone, on windswept farmland, consuming up to 1,500 MWh of electricity (each) per year. Most of these could be powered by wind turbines sited on farms adjacent to their transmitters.

Much of rural America is located in a wide north-south band covering most of the Midwest where wind speeds are high and consistent, dominated by smooth or laminar flow. (Figure above) There are 3,757 Television stations in the 20 windiest Midwest and South Central states serving 1,669 Counties. Wind energy production has grown in these areas, mainly in the form of large scale wind farms that supply electricity to regional transmission grids. We will develop a way for wind energy to improve the social and economic conditions of these rural communities by bringing wind energy directly to local television broadcast sites.
Electrical power is typically the second largest cost to a broadcaster (after personnel). The project will enable broadcasters to greatly reduce this expense by obtaining electricity at lower cost from on-site wind-generated power. This outcome will have a high impact on the viability and preservation of local broadcasting in rural communities.
Local wind generation will also contribute direct economic benefits to rural communities. Farmers, who typically own the land surrounding TV towers, will gain a new, reliable, on-site, and steady revenue source that can coexist with their existing operation. The new energy revenue source will be sold and used locally creating induced economic impacts or revenue exchanged among parties in the community. Construction and operation of new wind turbines for TV broadcasting will provide jobs and business for local contractors. After construction, the turbines will provide skilled jobs for operation and maintenance windsmiths, revenue for local lenders and increased revenue from property and business taxes.
Economic Advantages to the Broadcaster of On-Site Wind Production at the Transmitter
In most circumstances, centrally produced electricity distributed by a grid is more cost effective than electricity produced at distributed sites. However, electricity produced by a wind turbine at a broadcaster’s transmitter site has specific cost advantages over electricity produced centrally by utility wind farms. These advantages are the basis for the costs that a television station can save by installing on-site wind energy production.
- Backup Capacity. The price of electricity produced on a wind farm and sold by utilities over the grid must cover the cost of constructing and operating the wind turbines and fossil fueled load leveling generation capacity that can be switched on when wind is low and off when wind is high. (Wind is typically high at night when demand for grid electricity is low.) Electricity produced on-site for a transmitter does not require on-site load leveling capacity because the transmitter’s demand is constant day and night. All the electricity that the on-site generator can produce is mainly usable whenever it is produced. When the wind doesn’t blow, the electricity source reverts to the grid.
- Grid Connection. The price of electricity sold by utilities covers the cost of connecting the turbines in wind farms to the utility grid. This entails DC/AC conversion for inter- turbine connection, transformers to step up to the grid voltage, trenches and underground cable between turbines and to the grid connection point, and manned control centers to monitor performance of the farm. Connection to the grid also entails the soft costs of establishing contractual arrangements with multiple parties (energy producer, energy purchaser, utility, financing groups, insurers, distribution company, etc.) to ensure that the electricity produced will be purchased. On-site, or near on-site, electricity production by a broadcaster for his transmitter entails few or none of these costly complexities because there would be only one turbine, one user and the need for additional grid infrastructure would be significantly reduced.
- Site Preparation. A significant cost of bringing on a wind farm is preconstruction work to secure land for the turbines and permits. Real estate acquisition through purchase or lease often requires dealing with multiple owners that have conflicting objectives. Permits, approvals and interconnection agreements are required from all levels of government from local to federal as well as the local utility. Resolving these issues can take years. These issues vanish or become much simpler for a single turbine on or near a broadcaster’s transmitter. The turbine will be sited in an area approved for other tall commercial structures. The land is owned by either the broadcaster or a single farmer who would welcome additional lease income.
- Taxation. The tax structure favors producing wind energy on-site by the broadcaster/user over purchasing wind-produced energy from the utility. Electricity sold by the utility to the broadcaster is taxable as income to the utility. Because wind energy production requires no fuel, there are no fuel expenses to offset the income. On the other hand, inexpensive electricity generated on-site by the broadcaster saves him money, which is equivalent on his bottom line to income but creates no tax liability.
- Incentives. Many states and utilities offer incentives for on-site production of renewable electricity. They include net metering, renewable energy credits, production incentives, buydowns, favorable tax treatment, etc. They vary from state to state and often utility to utility, but all make positive contributions to the costs that a station can save by installing on-site wind energy production; sometimes up to 50% of the installed project cost.
The potential cost saving to a local broadcaster is substantial. Broadcasters purchase electricity from their utility companies at an average retail commercial rate of 10 cents per kWh. An on-site turbine in the wind-rich states can produce energy for far less money. Researchers at Lawrence Berkeley National Laboratory (LBNL) reported in February 2012 that the levelized cost of electricity (LCOE) produced by wind energy is expected to reach an all time low in 2012-2013 of 4-6 cents per kWh.1 The cost of on-site produced electricity will be even lower because on-site production does not bear the cost of building supporting grid infrastructure.
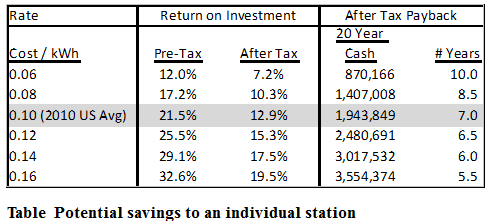
The return on investment for the broadcaster (and / or investor) is also substantial. The 7,652 TV and FM broadcast transmitters in the top 20 wind potential states use over 2 million MWh of electricity per year, costing approximately $200 million in 2010 (assuming average cost of $0.10 per kWh). In these states, an on-site turbine with an average 35% capacity factor and on-site net metering, could offset nearly all of its electricity expense. (FM transmitters are included because they are often co-sited with TV transmitters and could share the energy produced by a single wind turbine.) The potential cost benefit to an individual station is shown in Table 1.
A number of factors drive the profitability of each wind turbine installation. Table 1 assumes the purchase of a 500 kW turbine installed on-site with a capacity factor of 35% and annual maintenance costs of 1.3 cents per kWh produced. It also assumes an extension of the Production Tax Credit by Congress, a net metering agreement with the local utility company and a modest 10% Incentives Package from State / Utility.
The 20 Year cash back column represents the estimated after tax cash returned to the broadcaster / investor net of the cost of the turbine. As seen in the $0.10 power cost row, the investor should expect to receive an additional $1.9MM “in after tax dollars” following the project’s breakeven year 7.
DTV Interference Modeling
Rotating blades are known to introduce interference when turbines are located between TV transmitters and receivers.
Accurate modeling of RF interference is critical for several aspects of wind project development including efficient design, successful permitting and financial commitment.
Technical and economic efficiencies of wind turbines depend upon their size, height and siting, all of which interact strongly with their interference profiles for the transmitter.
Prospective RF interference with TV/FM reception can engender strong regulatory and community resistance to the project.
The uncertainty of prospective mitigation costs (including requirements to provide alternative service to affected reception areas) can compromise prospective project economics and impede financial commitment.
Broadcasters and wind energy developers confirm that they are currently unable to develop wind sites close to TV broadcast transmitters due to lack of ability to predict and rule out interference prior to construction.
Local television stations are cornerstones of rural community cohesion. However, local broadcasters find themselves under increasing financial pressure as costs rise and other media compete for advertising. These financial constraints pose significant challenges to rural livelihoods, wherein the closing of a local television station can be a severe loss to the community.
Broadcast Wind’s research will help to resolve these critical issues and enable wind turbines to be sited on land near television broadcast towers with benefits to farmers, broadcasters and rural communities. Farmers will gain a new source of revenue from their land, broadcasters will gain access to low cost electricity—one of their largest expenses—and rural communities will gain by retention of their local television station. Social science research indicates that positive socio-economic outcomes, such as community cohesion, retention of population, business investment, and many other measures of quality of life are associated with the presence of local broadcasting in smaller-sized, non-metropolitan markets. Our research explores relationships between local broadcasting and these benefits to rural communities, and suggests low-cost programs to further enhance community attachment as it is engendered by local broadcasting.
Macro-Economic Impact of Distributed Broadcast Wind Energy
Broadcast Wind conducted an analysis of the potential economic impact of distributed broadcast wind turbines within the country’s top 20 wind potential (as defined by the DOE) states using the National Renewable Laboratory’s (NREL’s) Job and Economic Development Impact (JEDI) model, modified to more accurately reflect distributed wind parameters.
The model includes economic multipliers developed by the Minnesota Implan Group using their Social and Accounting Impact Analysis software (version 3.0). While we anticipate other state broadcasters to become involved, we simplified our analysis by focusing on the top 20 windiest states.
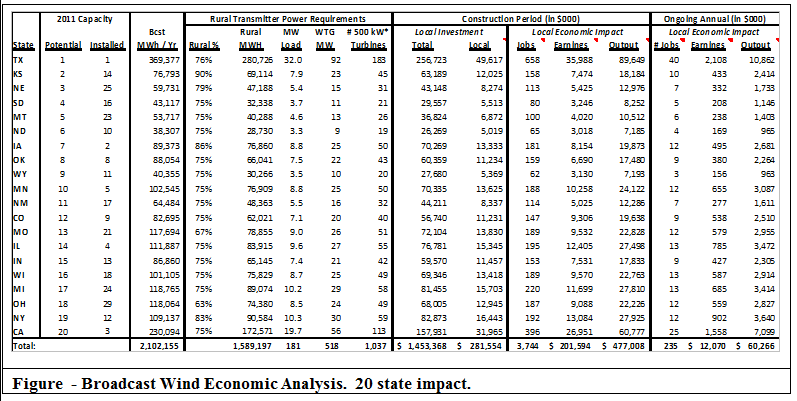
* The size of each turbine to be used at rural transmitter sites is driven by a number of factors including the local wind regime, the number of transmitters at the location, the annual MW load, the State’s renewable portfolio standard (RPS), and the local utility’s requirements and restrictions. Broadcast Wind estimates that turbine sizes will range from 100 kW for low power stations up to 1.5 MW for locations with multiple transmitters on-site.

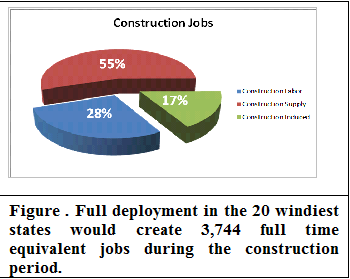
The result of our analysis shows that if fully realized, the 20 state capital investment would exceed $1.4B creating 3,744 full time equivalent jobs (1 FTE = 2080 hours of work) generating $202MM of earnings during construction and 235 permanent FTE jobs with annual salaries exceeding $12MM. The average project is 80% financed using a 9% cost of money. Ownership is assumed to be in state, with 50% of financing coming from local sources. Figure shows that 55% of the jobs created during construction are within the businesses that support and supply the construction efforts, while 17% represent “induced jobs”. These are the jobs created through local spending of earnings by the construction and related businesses’ employees on household / consumer items, groceries, and other local goods and services.
A fully deployed 20 state model also shows ongoing local economic stimulus exceeding $60MM per year (in 2012 dollars). Figure shows that 79% of this economic stimulus directly supports the emerging Midwest and South Central states’ wind energy supply industry, local owners, investors, farmland lessors, and local communities’ property tax base. 16% of the economic stimulus is induced, with employee income flowing into housing, retail and other local businesses.
Transmitter consumption (in MW hours) has been calculated using our Broadcast Wind database. Our estimates were derived using a combination of FCC registered transmitter power levels, frequency, transmitter manufacturer’s estimated power load levels, overhead for heating, lighting and air conditioning and hundreds of cross checks with broadcast station engineers around the country.
The economic analysis excludes transmitters located in urban settings. Exclusion of urban MW from the analysis gives the reader a clear accounting for the project’s impact to rural America.
Back to Top